Mission
Project Name: Robot Sensor Visualization
With our examples of Topics and Nodes within the ROS we were able to establish unidirectional communication channel topic and communicate with publisher and subscriber nodes.
We also saw that sensors attached to our robot communicates over a Topic, with each sensors publishing their data to a specific Topic. Although we may subscribe to these specific topics and extract the published data, without proper user interface, it is hard to decipher what the values mean just by looking at them.
In order to illustrate what the sensors are publishing to the topics, we use a visualization service called the isaac sight.
Isaac Sight is a web service mounted on our Jetson Nano board. It uses a Isaac node to listen to all the Topics that are present on the machine.
With Isaac sight we may display the odometry sensor values from position, velocity, and orientation or imu sensor values such as orientation and angular velocity in a graphs.
It also can display the LIDAR datas in a 2 dimensional map setting and other sensors.
For this mission, we will access Isaac Sight, and check how the visual representations change when we move our robots.
Accessing Isaac Sight
Isaac Sight web service is mounted on port:3000 and can be accessed via http://10.42.0.1:3000/ website. Make sure that the host computer is connected to the zeta wifi.
When the website is accessed, the screen similar to the following will be displayed:
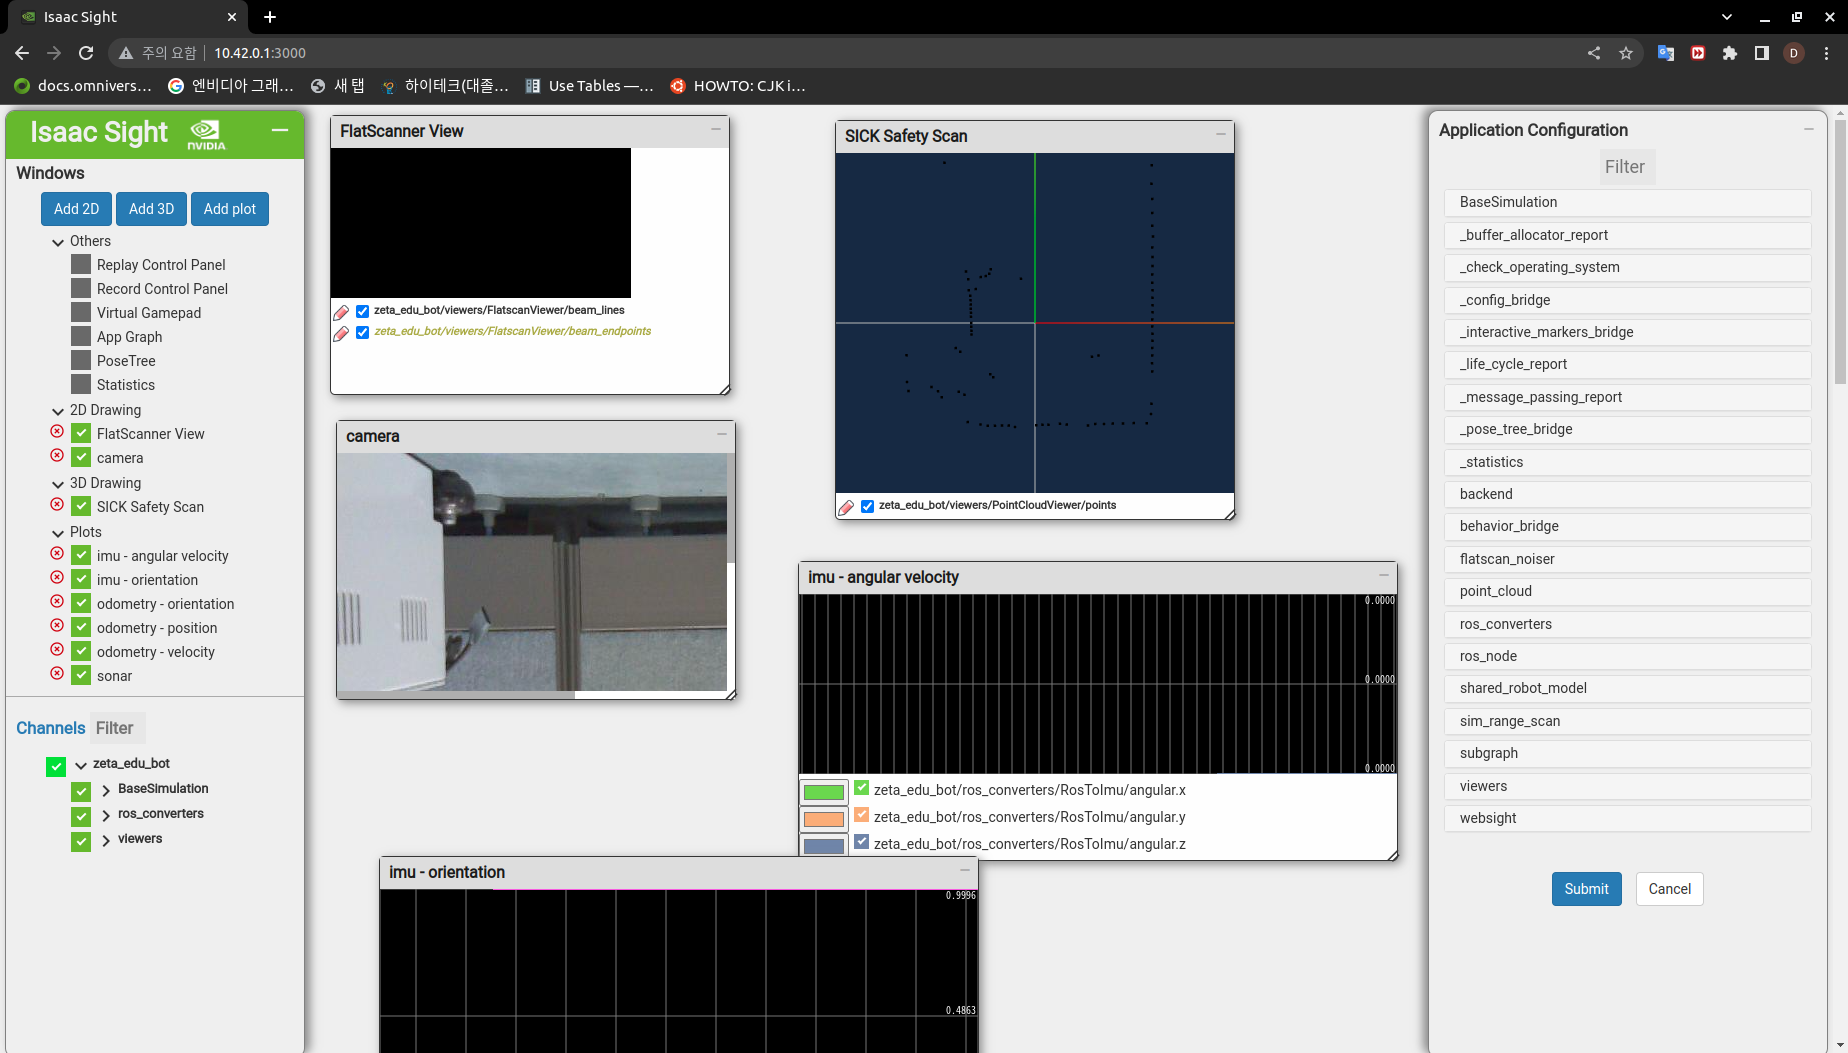
The middle of the section displays multiple windows with 2D visuals from various sensors. The color and other visual settings may be accessed via the pencil icon or by directly updating the setting by right clicking on the desired visual.
On the left you, the Isaac Sight displays all the available channels which can be visualized. Activate all the available sensors and check for the visuals.
Checking Visuals
Lets move our robot to check how the visuals of the sensors change.
Open the below jupyter file…